Camera Calibration using OpenCV
Actually this is one of the thing that I wanted to try last two year but at that time I didn't understand how to use it so I left it. But right now I have understood how to use this, so I would like to share it with you.
The usage is very simple. If you have already succeeded with capturing webcam using OpenCV, this example will be a lot more fun than that :D.
Suppose you have already connect your webcam to be captured using OpenCV, what you need to do is preparing these variables:
int patternCol(7);
int patternRow(4);
int numOfCorner(28);
int cornerCount(0);
int nBoards(8);
int successes(0);
int step(0);
CvPoint2D32f *cornerPoints;
Remember that you need to initialize the cornerPoints using new because it's a dynamic array.
Then, you need to add these lines into the callback of your webcam, suppose the variable of your callback is image:
int found = cvFindChessboardCorners(image, boardSize, cornerPoints, &cornerCount, CV_CALIB_CB_ADAPTIVE_THRESH);
cvDrawChessboardCorners(image, boardSize, cornerPoints, numOfCorner, found);
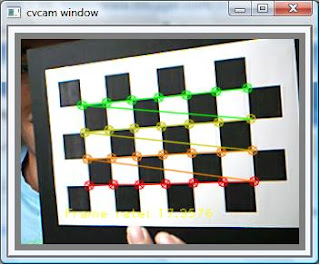
What you will see is that the chessboard corners are marked with a circle. If the circle has different colors, then it means the algorithm is successful. Something like this:
Then, the next thing you have to do is to save the position of the corners into a variable until you have enough images to perform the camera calibration. I tried using only 8 images, you can try more. I set the number of images using nBoards variable.
if( cornerCount == numOfCorner )
{
for( int i=step, j=0; j <>
{
CV_MAT_ELEM( *image_points, float, i, 0 ) = cornerPoints[j].x;
CV_MAT_ELEM( *image_points, float, i, 1 ) = cornerPoints[j].y;
CV_MAT_ELEM( *object_points, float, i, 0 ) = j/patternCol;
CV_MAT_ELEM( *object_points, float, i, 1 ) = j%patternRow;
CV_MAT_ELEM( *object_points, float, i, 2 ) = 0.0f;
}
CV_MAT_ELEM( *point_counts, int, successes, 0 ) = nBoards;
successes++;
}
Then, the next thing is to calibrate the camera using these lines of code:
CvMat* object_points2 = cvCreateMat( successes*nBoards, 3, CV_32FC1 );
CvMat* image_points2 = cvCreateMat( successes*nBoards, 2, CV_32FC1 );
CvMat* point_counts2 = cvCreateMat( successes, 1, CV_32SC1 );
// Transfer the points into the correct size matrices
for( int i = 0; i <>
{
CV_MAT_ELEM( *image_points2, float, i, 0) = CV_MAT_ELEM( *image_points, float, i, 0 );
CV_MAT_ELEM( *image_points2, float, i, 1) = CV_MAT_ELEM( *image_points, float, i, 1 );
CV_MAT_ELEM( *object_points2, float, i, 0) = CV_MAT_ELEM( *object_points, float, i, 0 );
CV_MAT_ELEM( *object_points2, float, i, 1) = CV_MAT_ELEM( *object_points, float, i, 1 );
CV_MAT_ELEM( *object_points2, float, i, 2) = CV_MAT_ELEM( *object_points, float, i, 2 );
}
for( int i=0; i <>
{
CV_MAT_ELEM( *point_counts2, int, i, 0 ) = CV_MAT_ELEM( *point_counts, int, i, 0 );
}
// At this point we have all the chessboard corners we need
// Initiliazie the intrinsic matrix such that the two focal lengths
// have a ratio of 1.0
CV_MAT_ELEM( *intrinsic_matrix, float, 0, 0 ) = 1.0;
CV_MAT_ELEM( *intrinsic_matrix, float, 1, 1 ) = 1.0;
// Calibrate the camera
cvCalibrateCamera2( object_points2, image_points2, point_counts2, cvSize( image->width, image->height ),intrinsic_matrix, distortion_coeffs, NULL, NULL, CV_CALIB_FIX_ASPECT_RATIO );
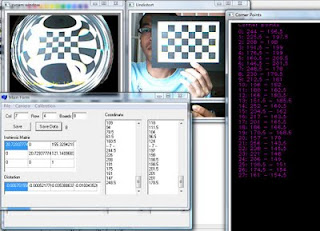
the output of the calibration is these two matrices: intrinsic_matrix, distortion_coeffs. You can save it into a file using cvSave(...) or directly call it from somewhere in your program.
These are some excerpts of the steps that I implement in my program. I followed the examples provided in Chapter 11 of OpenCV book :). If you're interested just try it :D
Wait for my next post about why this camera calibration stuff is important, hehehe... :D
Labels: borland c++ builder, fun, opencv, programming, webcam, work
posted by mario at
9:25 PM
|
0 comments
![]()